Friday, May 25, 2012

Peak Copper

Since copper prices have increased massively starting in 2004, copper peak theories have been suggested.

Although copper is essentially the ultimate renewable resource (and also available quite abundantly in lower grades) the discussion has gained some traction especially following Jean Laherrrère's slide collection, which was reproduced here and  here.

The following provides an update of the Hubbert linearization with data extended to 2011 (based on Hubbert's original 1956 paper on fossil fuels and a Hubbert math summary) and a naive top-down estimate of Qtot.


Based on the above Qmax end up being 4.7 billion tons (whereof approx. 0.6 billion tons have been mined as of 2011). USGS noted the following on world copper resources:
"A 1998 USGS assessment estimated 550 million tons of copper contained in identified and undiscovered resources in the United States. Subsequent USGS reports estimated 1.3 billion tons and 196 million  tons of copper in the Andes Mountains of South America and in Mexico, respectively, contained in identified, mined, and undiscovered resources. A preliminary assessment indicates that global land-based resources exceed 3 billion tons. Deep-sea nodules and submarine massive sulfides are unconventional copper resources."
Reserves are estimated at 0.55 billion tons. Note below reserve and resource definitions from USGS.
"Reserve: That part of an identified resource that meets specified minimum physical and chemical criteria related to current mining and production practices, including those for grade, quality, thickness, and depth."
"Resource: A concentration of naturally occurring solid, liquid, or gaseous material in or on the Earth’s crust in such form and amount that economic extraction of a commodity from the concentration is currently or potentially feasible."
Although copper production data doesn't really lend itself to Hubbert linearization, the Qmax of 4.7 billion tons is broadly in line with USGS's resource estimate (which excludes already mined mineral).

There have been suggestions to use alternative periods for the fit of Hubbert linearization. Results are summarized below:


It seems that the year of peak primary production is somewhere between 2030 and 2070, probably after 2050. From this perspective (admittedly a somewhat naive view from 10'000 m altitude), it would seem that the peak copper narrative is not so relevant.

We aim to address two aspects providing additional support to the above from separate angles in future posts:

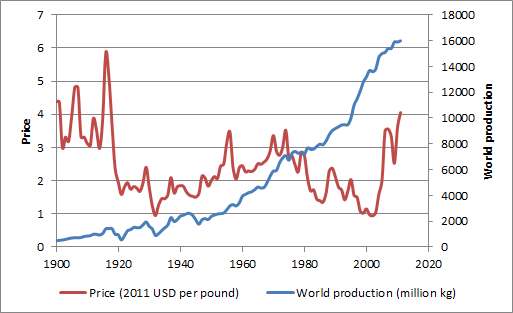
  • Relative prices of energy and copper (energy as a key input factor to copper production cost and copper as a key input factor for renewable energy production cost)
  • Recycling / secondary production

Thursday, May 10, 2012

World Population Data 1820 - 2008

I have now expanded the the GGDC/Maddison dataset filling the missing datapoints using the same growth pattern as neighboring countries. Obviously this exercise should be taken with a grain of salt as the additional data points are not based on original research.

Population (in 000) and decadal population growth for Western Europe, Western Offshoots, Eastern Europe & FSU and Latin America.


Population (in 000) and decadal population growth for China/Hong Komg/Taiwan, Pakistan/India/Bangladesh, Rest of Asia and Africa.


Source data is here.

Wednesday, April 25, 2012

Correlation between Copper and Chilean Peso (3)

Happy to provide the missing piece of the additional analysis requested by a reader.


Calculated correlation based on monthly, quarterly and yearly time series using 12 months, 10 quarters and 5 years on a rolling basis. Plotted below against copper market share of exports.


Following conclusions can be drawn:
  • For shorter time intervals you get more noise, but an a yearly basis you get very high correlation (i.e. low correlation coefficient smaller than -80%)
  • There seem to be periods with high correlation regimes (1992-1998, 2003 to present)
  • Correlation breaks-down in 1989-2991 and 1999-2002

Tuesday, April 10, 2012

Correlation between Copper and Chilean Peso (2)

Taking up a reader comment, I have updated the export data back to 1989. I have also eliminated the data from the free economic zone as they tend to be re-exports, so overall data for 1996-2010 might look slightly differently. Clearly from 1989 to 1993 the dependency on copper has been reduced from 50% to 35%. After 2003 dependency increased again to a level of almost 60%.


Other mining can be decomposed as follows (values for 2010 in USD million). Molybdenum and gold are generally by-products of copper mining. Lithium's importance is much lower than widely assumed.


Answering the question of the commodity nature of the "other" export is not straight forward, although both the agro and more importantly industrial segments could be classified to a significant extent as commodity based with lower value addition:

Agro is mostly fruit and represents 6.3% of total exports.
Industrial is more diversified and represents 28.4% of exports. Within the industrial bucket the largest contributors are cellulose (12.3% of industrial), salmon (10.2%), wine (7.9%), wood (6.8%), fish meal (2.6%), copper wire (2.4%) and transport material (2.1%).

Will follow-up with a separate post with the development of R2 and beta based on monthly data points.

Sunday, March 25, 2012

Copper Volume Forecasting

Similar to our review of Cochilco's price forecasts, we decided to look at copper production forecasts by ICSG. Given that ICSG and Cochilco are relatively transparent organization and make their respective forecasts available to the public domain, such reviews may be viewed as somewhat unfair. However, we do understand the challenges of forecasting and are certainly not claiming that we would do better.

The following graph plots the development for forecast world copper production volume as a percentage of the ultimate or last available production volume for the calendar years 2005 to 2011. Reading example: On 28 April 2006 (1.67 years before the end of calendar year 2007), ICSG forecasted a production volume 16'296 million tons for 2007, while the actual production volume was 15'483 millions tons (as reported on 30 April 2012). The initial forecast is 5.4% higher than the final value (depicted as a large green triangle at <-1.67, 5.4%>).


Clearly production volumes have been systematically overestimated. This is interesting because the same asymmetric forecast development is not found for surplus/deficit numbers of refined copper, although the numbers for 2007 and 2010 saw large movements from a forecasted surplus to a realized deficit of refined copper.


Saturday, March 10, 2012

Correlation between Copper and Chilean Peso (1)

In September 2009, the Chilean National Bank (Banco Central de Chile) provided a good summary of the dependency of the Chilean economy on copper exports

The main theme of the presentation is that while copper continues to be very important, the growth of non-copper exports have gained higher importance and that Chile has managed its natural resource curse successfully.

The latter is probably true, but because of elevated copper prices for the last couple of years the copper exports as a percentage of total export have actually increased and now stood at 55% in 2011 (data source 1996-2010, 2011 own estimates, note that manufactured copper products like copper wire are included under 'Other').


This is reflected in higher correlation between Copper and Chilean Peso (CLP) in most recent years (2001-2011 compared to 1990-2000). R2 has increased from 41% to 69%, the absolute value of beta has increased from 13% to 24% (reading example: a 10% increase in Copper prices leads to a 2.4% strengthening of the CLP [CLPUSD decreasing]).


Saturday, February 25, 2012

Relationship between Copper Price and Copper Production / Consumption

In principle we would like to analyze whether there is a dependency between world copper consumption and copper price. To our knowledge there is no long range world consumption data available. However, USGS provides US consumption and world production data.

As we are only interested in change metrics (not necessarily the absolute values themselves), we bravely chose to take change of world production as a substitute for world consumption, thereby ignoring changes in recycling  rates and stock levels. The data looks as follows:


Looking at the annual changes is more interesting to establish any relationship whether copper is a good indicator of consumption. this looks as follows (each dot represents a calendar year):


Ten year rolling correlation coefficient (and R2) looks as follows:


Our conclusions are as follows:
  • Until 1980, Copper price was largely demand driven, with higher demand driving up copper prices. Production seemingly matched consumption or the changes to recycling rates and stock levels were not material enough to distort the picture.
  • Since 1980 but especially for the last 15 years, the situation has become much more distorted, while volatility of world production (on a percentage basis) is at its lowest level since 1900, price volatility is at its maximum.
  • Accordingly higher prices have recently not translated in higher production. At this stage of the analysis, it remains open to us what the underlying reasons are
We have also looked at the question whether copper price to copper production relationship is of lagging, concurrent or leading nature. The data suggested concurrent, but given that we have worked with annual data points we may need to refine this with monthly or quarterly data.

Friday, February 10, 2012

GDP per Capita Time Series 1820 - 2008 (Western Europe)

as a preparation for the pending correlation analysis between GDP and Copper Consumption/Production, I looked at the Maddison data from the Groningen Growth and Development Centre.

GDP data is expressed in Geary-Khamis dollars, see also UN Statistics Division definition. Obviously historical GDP data is fraught with uncertainty both as a result of data availability and methodological issues (I'm not really a fan of PPP adjustments). Also some of the countries didn't exist or territories changed during the 1820 - 2008 period. Therefore, the data is based on today's frontiers.

The following graphs shows the average GDP per capita for Western Europe including the following 30 countries: Austria, Belgium, Denmark, Finland, France, Germany, Italy, Netherlands, Norway, Sweden, Switzerland, United Kingdom (including Ireland until 1920), Ireland, Greece, Spain, Portugal, Other (Andorra, Cyprus, Faeroe Islands, Gibraltar, Greenland, Guernsey, Iceland, Isle of Man, Jersey, Liechtenstein, Luxembourg, Malta, Monaco, San Marino).


The income per capita relative to the Western Europe average for the 16 medium and large countries:


And the richest and poorest country for any given year.


Calculation details can be found here.


Wednesday, January 25, 2012

Copper Price Forecasting


Forecasting is notoriously difficult, the same applies to copper prices. We have looked at Cochilco's copper price forecasts since 2004 and tracked the following three prices for each calendar year (all values in cents per pound):


  1. Spot price as of June 30, Y-1 (i.e. spot price on June 30, 2004 is 122 cents/pound)
  2. Forecast by Cochilco made on June 30, Y-1 for the average of Y (i.e. forecast made on June 30, 2004 for average of 2005 is 118 cents per pound)
  3. Actual average spot prices for Y (i.e. the average spot price for 2005 is 167 cents per pound)


The deviation of the forecasts and effective value compared to the spot price at the date of the forecast can be plotted as follows:


The correlation between the two time series is -0.07, indicating no predictive power whatsoever.

Actually we don't want to pick on Cochilco. We choose them because they are most likely least biased of all the forecasters. They also might have some additional data and insight being associated with the largest copper producing country.

Tuesday, January 10, 2012

Analysis Program

According to Investopedia:


"Doctor Copper" - Market lingo for the base metal that is reputed to have a Ph.D. in economics because of its ability to predict turning points in the global economy. Because of copper's widespread applications in most sectors of the economy - from homes and factories, to electronics and power generation and transmission - demand for copper is often viewed as a reliable leading indicator of economic health. This demand is reflected in the market price of copper. Generally, rising copper prices suggest strong copper demand and hence a growing global economy, while declining copper prices may indicate sluggish demand and an imminent economic slowdown.” 


Over the next couple of weeks, we will address the following two fundamental questions:
  • Have copper prices actually been a good indicator of turning points in the global economy? Do do so we will assess historical time series of world GDP (possibly also US, China and Chile), copper production volume and copper price. We will also look at the question whether copper prices are early, concurrent and lagging indicators and address the question whether the relationship (provided we find one) has changed over time.
  • What developments will challenge or strengthen the predictive power of copper prices? We name just a few which we aim to discuss in much more detail:
    • Substitution of copper usage (we have heard about Dean Lumber and Dr. Aluminium)
    • Monetization and off exchange warehouse storage, i.e. dark inventory (for wealth preservation and finance / securitization purposes)
    • Increasing recycling rates (copper doesn't degrade and the copper reservoir is significant)
    • Peak copper (lower production and lower grades) compensated by increased copper usage
    • New uses of copper (antibacterial, renewable energy)
    • More efficient design specifications lowering copper content