Saturday, February 25, 2012

Relationship between Copper Price and Copper Production / Consumption

In principle we would like to analyze whether there is a dependency between world copper consumption and copper price. To our knowledge there is no long range world consumption data available. However, USGS provides US consumption and world production data.

As we are only interested in change metrics (not necessarily the absolute values themselves), we bravely chose to take change of world production as a substitute for world consumption, thereby ignoring changes in recycling  rates and stock levels. The data looks as follows:
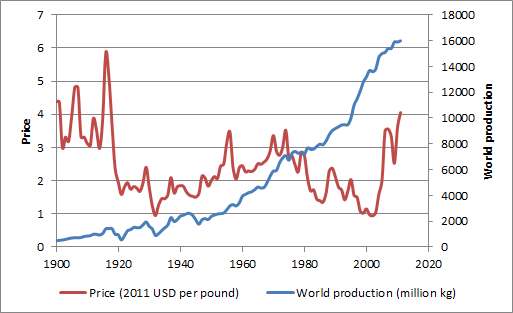


Looking at the annual changes is more interesting to establish any relationship whether copper is a good indicator of consumption. this looks as follows (each dot represents a calendar year):


Ten year rolling correlation coefficient (and R2) looks as follows:


Our conclusions are as follows:
  • Until 1980, Copper price was largely demand driven, with higher demand driving up copper prices. Production seemingly matched consumption or the changes to recycling rates and stock levels were not material enough to distort the picture.
  • Since 1980 but especially for the last 15 years, the situation has become much more distorted, while volatility of world production (on a percentage basis) is at its lowest level since 1900, price volatility is at its maximum.
  • Accordingly higher prices have recently not translated in higher production. At this stage of the analysis, it remains open to us what the underlying reasons are
We have also looked at the question whether copper price to copper production relationship is of lagging, concurrent or leading nature. The data suggested concurrent, but given that we have worked with annual data points we may need to refine this with monthly or quarterly data.

Friday, February 10, 2012

GDP per Capita Time Series 1820 - 2008 (Western Europe)

as a preparation for the pending correlation analysis between GDP and Copper Consumption/Production, I looked at the Maddison data from the Groningen Growth and Development Centre.

GDP data is expressed in Geary-Khamis dollars, see also UN Statistics Division definition. Obviously historical GDP data is fraught with uncertainty both as a result of data availability and methodological issues (I'm not really a fan of PPP adjustments). Also some of the countries didn't exist or territories changed during the 1820 - 2008 period. Therefore, the data is based on today's frontiers.

The following graphs shows the average GDP per capita for Western Europe including the following 30 countries: Austria, Belgium, Denmark, Finland, France, Germany, Italy, Netherlands, Norway, Sweden, Switzerland, United Kingdom (including Ireland until 1920), Ireland, Greece, Spain, Portugal, Other (Andorra, Cyprus, Faeroe Islands, Gibraltar, Greenland, Guernsey, Iceland, Isle of Man, Jersey, Liechtenstein, Luxembourg, Malta, Monaco, San Marino).


The income per capita relative to the Western Europe average for the 16 medium and large countries:


And the richest and poorest country for any given year.


Calculation details can be found here.


Wednesday, January 25, 2012

Copper Price Forecasting


Forecasting is notoriously difficult, the same applies to copper prices. We have looked at Cochilco's copper price forecasts since 2004 and tracked the following three prices for each calendar year (all values in cents per pound):


  1. Spot price as of June 30, Y-1 (i.e. spot price on June 30, 2004 is 122 cents/pound)
  2. Forecast by Cochilco made on June 30, Y-1 for the average of Y (i.e. forecast made on June 30, 2004 for average of 2005 is 118 cents per pound)
  3. Actual average spot prices for Y (i.e. the average spot price for 2005 is 167 cents per pound)


The deviation of the forecasts and effective value compared to the spot price at the date of the forecast can be plotted as follows:


The correlation between the two time series is -0.07, indicating no predictive power whatsoever.

Actually we don't want to pick on Cochilco. We choose them because they are most likely least biased of all the forecasters. They also might have some additional data and insight being associated with the largest copper producing country.

Tuesday, January 10, 2012

Analysis Program

According to Investopedia:


"Doctor Copper" - Market lingo for the base metal that is reputed to have a Ph.D. in economics because of its ability to predict turning points in the global economy. Because of copper's widespread applications in most sectors of the economy - from homes and factories, to electronics and power generation and transmission - demand for copper is often viewed as a reliable leading indicator of economic health. This demand is reflected in the market price of copper. Generally, rising copper prices suggest strong copper demand and hence a growing global economy, while declining copper prices may indicate sluggish demand and an imminent economic slowdown.” 


Over the next couple of weeks, we will address the following two fundamental questions:
  • Have copper prices actually been a good indicator of turning points in the global economy? Do do so we will assess historical time series of world GDP (possibly also US, China and Chile), copper production volume and copper price. We will also look at the question whether copper prices are early, concurrent and lagging indicators and address the question whether the relationship (provided we find one) has changed over time.
  • What developments will challenge or strengthen the predictive power of copper prices? We name just a few which we aim to discuss in much more detail:
    • Substitution of copper usage (we have heard about Dean Lumber and Dr. Aluminium)
    • Monetization and off exchange warehouse storage, i.e. dark inventory (for wealth preservation and finance / securitization purposes)
    • Increasing recycling rates (copper doesn't degrade and the copper reservoir is significant)
    • Peak copper (lower production and lower grades) compensated by increased copper usage
    • New uses of copper (antibacterial, renewable energy)
    • More efficient design specifications lowering copper content